Wreno: Dashboard
Project Overview
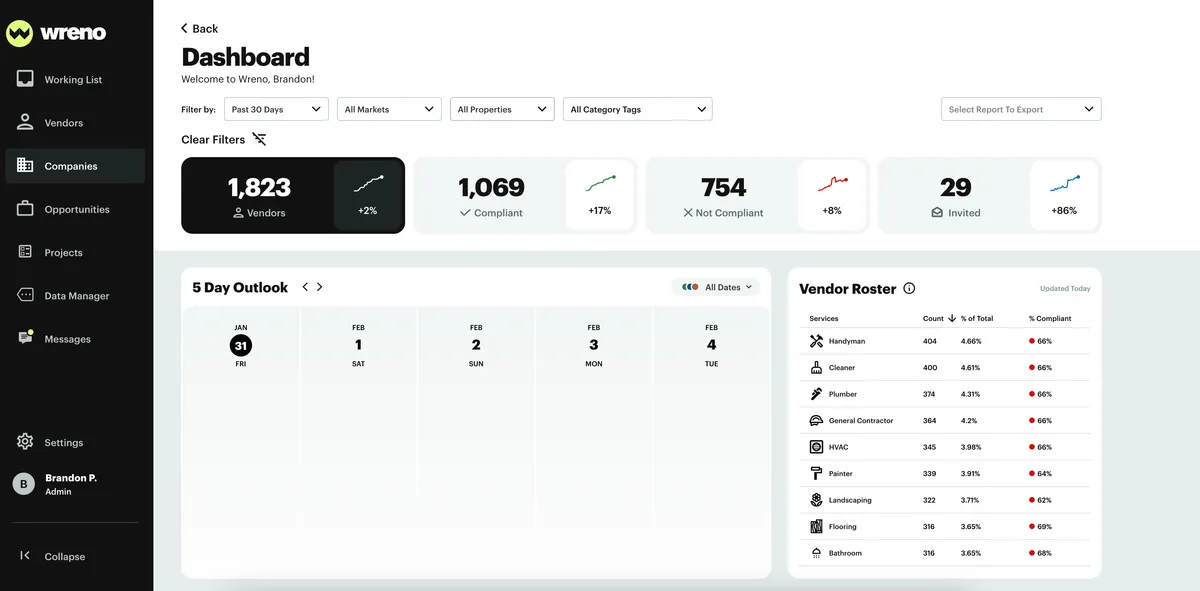
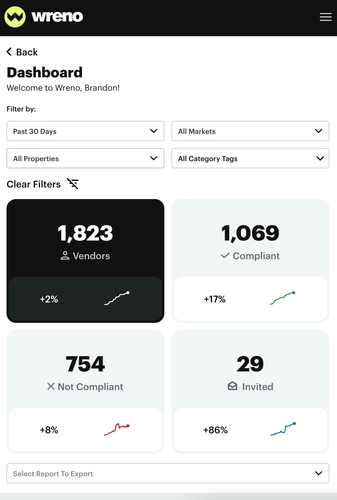
The goal was simple: help property managers make data-driven decisions. Our existing system collected vast amounts of data, but users lacked a streamlined way to access and analyze it. We built a new dashboard to surface critical insights, allowing property managers to track compliance trends, monitor key events, and ultimately make better strategic decisions for their businesses.
Technical Overview
We structured our solution around a robust data pipeline. The backend collected data from multiple sources and stored it in a Postgres database, which was then served through a NodeJS API. The key challenge was ensuring efficient querying, especially for time-series event data that powered our visualizations.
Spark Line Graphs
- Created a separate event table to store relevant historical data.
- Processed events canonically to compute aggregate counts over time.
- Optimized database queries to ensure high performance at scale.
Data Exports
- Google Cloud Run Jobs managed the serverless processing.
- NodeJS Streaming API efficiently streamed data from the database to the CSV output.
- Pagination ensured we didn’t overload memory with large datasets.
- Readable Streams allowed efficient data transfer to the frontend.
- Fetch API and Blob storage provided downloadable files for users.
Frontend Visualization
- Leveraged D3.js for dynamic charts.
- Used React to build a responsive UI.
Roles and Responsibilities
As the Tech Lead, I oversaw the project’s technical direction and managed one other developer. My primary contributions included:
- Leading architectural decisions to optimize data handling and visualization.
- Designing and implementing the spark line system for real-time trend analysis.
- Developing the event calendar system to provide a historical view of property management events.
- Building a scalable export system to allow property managers to extract their data efficiently.
This project significantly improved how our users interacted with their data, enabling them to take a more proactive approach to compliance and performance tracking. It was a rewarding challenge that showcased the power of well-structured data and thoughtful UX design.

NodeJS
TypeScript
React
Postgres
Performance
D3
October 15, 2024